PART IV
 Population Pyramid W
Population:
The population statistics of a country can help in inferring about that country's economy and resources. Examining the most recent population graphs (see Population Pyramid W), one can observe that Ireland's population is slowly increasing. Acknowledging the instability in the pyramid, at the low end of the reproductive age bracket, one can infer that there was a relatively recent event that decreased the population. However, the numbers are again on the rise. See the rate of population growth and more important statistics below:
The population statistics of a country can help in inferring about that country's economy and resources. Examining the most recent population graphs (see Population Pyramid W), one can observe that Ireland's population is slowly increasing. Acknowledging the instability in the pyramid, at the low end of the reproductive age bracket, one can infer that there was a relatively recent event that decreased the population. However, the numbers are again on the rise. See the rate of population growth and more important statistics below:
|
Key Population Information:
|
|
Through the population pyramid and its associated information, one can speculate about many things. For instance, because the population is facing an increase, it is likely that Ireland has a developing industrial economy. Inversely, one can see the instability in the pyramid at the low end of the reproductive age bracket (ages 15 - 44) and infer that a relatively recent event (approximately 30 years ago) decreased the population. At it's current rate of growth, visible in the incremental lengthening of the pre-reproductive numbers, the population can be expected to steadily increase in future years.
 GDP graph X
GDP and Exports:
(All figures in $US)
As of Q1 2013 has a Gross Domestic Product of around $217.8 billion dollars. See GDP graph X to the left. From 1990 on the far-left of the graph, Ireland's GDP has visibly risen a great deal, indicating economic prosperity. Recently, however the figure has leveled out, even fallen.
Below, see the breakdown of Ireland's GDP in graph Y:

GDP breakdown graph Y
|
As far as the country's economy itself, success is achieved for the most part by trade with foreign multinationals. Ireland's most prominent trade partners are (in descending value percentage) the United States, United Kingdom, Belgium, Germany, France, and Spain. Globally, Ireland ranks 32 in exports. In 2012, Ireland exported
$251 billion dollars worth of product, and imported $111 billion dollars worth. With these figures, the import to export ratio shows positive trade flow. However, Ireland is a debtor country, with a government debt measuring 123% of its GDP -- over $228.5 billion dollars in debt as of this point. CLICK HERE FOR IRELAND DEBT CLOCK |
Renewable Water and Energy Resources:
Statistically, 99.9% of Ireland's total urban and rural population has access to drinking water and sanitation facilities. In total, Ireland has about 52 cubic kilometres of water from renewable sources. See Renewable Water Resources per capita compilation Z below:
Statistically, 99.9% of Ireland's total urban and rural population has access to drinking water and sanitation facilities. In total, Ireland has about 52 cubic kilometres of water from renewable sources. See Renewable Water Resources per capita compilation Z below:
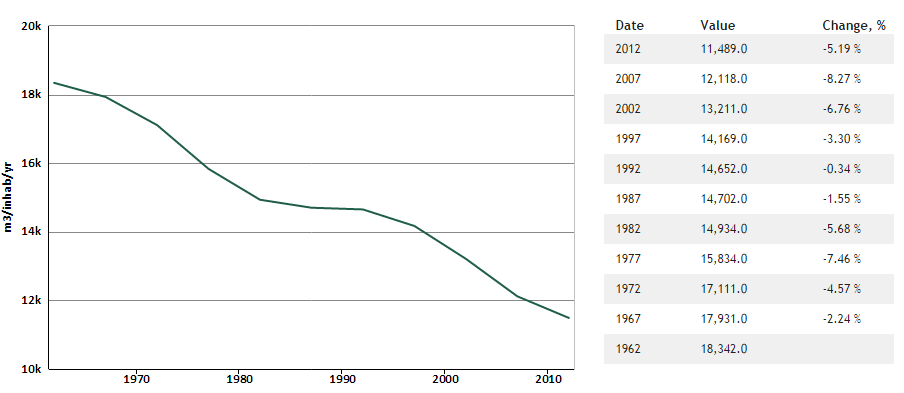
Renewable Water Resources per capita graph and table Z
The current water withdrawal rate per capita per year is 226.9 cubic metres, for a total withdrawal of 0.79 cubic kilometres per year. A good 94% of the annual withdrawal is used for domestic purposes, and 6% in industry. You can see both visually and mathematically how this is decreasing the amount of water available for use. One of Ireland's biggest environmental issues, water pollution, takes even more water out of the equation.
As for energy statistics, Ireland's electricity production/consumption ratio is 26.04 billion kWh to 26.1 billion kWh -- a net 66th in comparison to the world. Of the total installed generating capacity of 8.316 million kW, 72.6% comes from finite fossil fuels, chiefly peat, oil, and natural gas. However, Ireland is making a transition to renewable sources of power, and as of 2010, 2.9% of installed capacity comes from hydroelectric plants, and 17.4% from other renewable sources such as wind power. According to the Irish Minister for Energy, a new target of 45% renewable energy in the EU by 2030 has been set to work toward driving Europe out of the nonrenewable energy crisis to a strong, sustainable growth path.
As for energy statistics, Ireland's electricity production/consumption ratio is 26.04 billion kWh to 26.1 billion kWh -- a net 66th in comparison to the world. Of the total installed generating capacity of 8.316 million kW, 72.6% comes from finite fossil fuels, chiefly peat, oil, and natural gas. However, Ireland is making a transition to renewable sources of power, and as of 2010, 2.9% of installed capacity comes from hydroelectric plants, and 17.4% from other renewable sources such as wind power. According to the Irish Minister for Energy, a new target of 45% renewable energy in the EU by 2030 has been set to work toward driving Europe out of the nonrenewable energy crisis to a strong, sustainable growth path.
In the World... :
To put this information into perspective, let's compare Ireland to another, similar country -- New Zealand. Both countries are islands, and they have equal populations of about 4.5 million. Viewing New Zealand's population pyramid, however, one can observe it is much more stable the Ireland's, and the rate of population growth isn't as severe -- only 0.83% per year to Ireland's 1.2% per year. This hints at a more developed industrial economy.
Resource-wise, New Zealand has much more renewable water reserves. While Ireland has 52 cubic kilometres, New Zealand has 327 cubic kilometres. Though the populations are similar, New Zealand has a much higher water withdrawal, at 4.75 cubic kilometres per year to Ireland's 0.79 cubic kilometres per year. This graph contrasts that information. Electricity and renewable energy statistics also differ between the two countries. New Zealand's installed generating capacity is much less than Ireland's -- only 9.7 million kW to Ireland's 26 billion kW. However, New Zealand has a much higher percentage of renewable sources. While in Ireland only about 20% of electricity is from a sustainable source, in New Zealand, the number is closer to 66%.
Finally, the two countrys' GDPs are comparable. Both experienced similar rises and falls at corresponding points in time. See that information on this interactive graph. Overall, the countries have relatively similar GDPs. In measures of US$, Ireland's GDP $217.8 billion, and New Zealand's is $182.6 billion. However, as is visible on the linked graph, Ireland's GDP has been falling recently, while New Zealand has not experienced any similar economic downturn.
